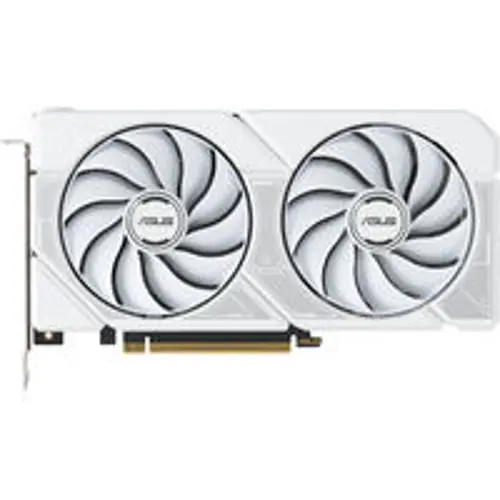
Graphics card
ASUS Dual GeForce RTX 5060 Ti White OC 16 GB
A graphics card by ASUS, based on the RTX 5060 Ti 16GB GPU from NVIDIA. Equipped with 16 GB of GDDR7 memory. Architecture: Blackwell.
At 1440p without ray tracing, average gaming performance is 61.1 FPS. This card’s GPU model ranks 25 out of 59 for gaming performance, with a Gaming Index score of 26.8 out of 100. As of November 2026, it ranks 25 out of 33 for value for money, with a Value Index score of 42.2 out of 100, calculated using prices for new graphics cards in the selected markets.
At 1440p with ray tracing, average gaming performance is 45.2 FPS. This card’s GPU model ranks 24 out of 50 for gaming performance, with a Gaming Index score of 25 out of 100. As of November 2026, it ranks 23 out of 31 for value for money, with a Value Index score of 44.5 out of 100, calculated using prices for new graphics cards in the selected markets.
At 1440p without ray tracing, average gaming performance is 61.1 FPS. This card’s GPU model ranks 25 out of 59 for gaming performance, with a Gaming Index score of 26.8 out of 100. As of November 2026, it ranks 28 out of 31 for value for money, with a Value Index score of 30.1 out of 100, calculated using prices for used graphics cards in the selected markets.
At 1440p with ray tracing, average gaming performance is 45.2 FPS. This card’s GPU model ranks 24 out of 50 for gaming performance, with a Gaming Index score of 25 out of 100. As of November 2026, it ranks 28 out of 30 for value for money, with a Value Index score of 31.1 out of 100, calculated using prices for used graphics cards in the selected markets.
Highlights
- Boost clock: 2,602 MHz (+1.2% vs reference clock)
- Length: 229 mm
Compare prices, specifications and performance with other graphics cards.
Available offers — new or used
Selected markets
New
from USD 839.89
Used
from USD 789.50Compare a few more models:
- Radeon RX 9070 XT From ≈ USD 899 69% faster 7% pricier
- Radeon RX 9070 From USD 749.99 51% faster 11% cheaper
- Radeon RX 9070 GRE From ≈ USD 646 27% faster 23% cheaper
1440p · Without RT · New
Compared with GeForce RTX 5060 Ti 16 GB
· USD 839.89 · 61 FPS
Prices may change; check the retailer for the latest price. This page includes affiliate links. Retailers may pay PCPartVS a commission when you buy through them, at no extra cost to you. Learn more
Where to compare prices
Prices and value-for-money metrics use offers from the countries you select.
Performance and value
Average FPS and value for money at each resolution.
1080p
Full HD- Average FPS
- 85.7 25 of 61
- FPS / 100$
- 10.21 No ranking
- Performance
- 36.8 / 100 25 of 61
- Value
- 42 / 100 No ranking
1440p
Quad HD- Average FPS
- 61.1 25 of 59
- FPS / 100$
- 7.27 No ranking
- Performance
- 26.8 / 100 25 of 59
- Value
- 42.2 / 100 No ranking
4K
Ultra HD- Average FPS
- 32.9 27 of 57
- FPS / 100$
- 3.92 No ranking
- Performance
- 23.4 / 100 27 of 57
- Value
- 41.6 / 100 No ranking
1080p
Full HD- Average FPS
- 64.4 22 of 55
- FPS / 100$
- 7.67 No ranking
- Performance
- 30.9 / 100 22 of 55
- Value
- 47.5 / 100 No ranking
1440p
Quad HD- Average FPS
- 45.2 24 of 50
- FPS / 100$
- 5.38 No ranking
- Performance
- 25 / 100 24 of 50
- Value
- 44.5 / 100 No ranking
4K
Ultra HD- Average FPS
- 25.2 22 of 49
- FPS / 100$
- 3 No ranking
- Performance
- 27.1 / 100 22 of 49
- Value
- 48 / 100 No ranking
How to read metrics and rankings
Performance / 100 — a gaming performance score. Scores are normalized from 1 to 100 across GPU models with test data for the same resolution and mode; 100 is the highest performance. Adding or removing comparison models does not change this scale.
Average FPS — an estimated average frame rate across the test set for the selected resolution and mode. Results in a particular game may differ. These figures apply to the GPU model and all graphics cards based on it.
Value / 100 — the ratio of underlying performance to price, normalized from 1 to 100. It includes GPU models with test data and prices for the selected condition in the selected markets. A score of 100 marks the best performance for the money.
FPS / 100$ — average FPS ÷ price in the selected currency × the amount shown in the label. The price follows the selected condition. Higher is better. For example, 60 FPS at a price of 300 in the selected currency gives 20 FPS per 100.
Bars — in the metric cards, performance and value for money use a 0–100 scale. For average FPS and FPS for the money, a full bar represents the highest value among all models with data for the same resolution and mode. Price-based metrics also follow the selected condition. For example, 20 FPS with a maximum of 100 FPS fills 20% of the bar.
Rank — the position among all GPU models with data for that metric, including models not selected for comparison. Average FPS, Performance and value-for-money metrics may have different ranks and participant counts. Graphics cards based on the same GPU model do not add ranking entries.
Compare GPU models
Your current selection and up to three other GPU models.
Could not load. Try searching or selecting the model again.
- RTX 5060 Ti16 GB Current · USD 839.89
- RTX 509032 GB ≈ USD 7,230
Add a GPU model to compare
Four models selected. Remove one to add another.
Average FPS
Average frame rate in the selected test mode.
1080pFull HD
1440pQuad HD
4KUltra HD
Shared scale: 0–198.6. Differences are relative to the current card.
FPS / 100$
Average FPS per the indicated amount in your selected currency.
1080pFull HD
1440pQuad HD
4KUltra HD
Shared scale: 0–10.21. Differences are relative to the current card.
Specs
General
- GPU vendor
- NVIDIA
- GPU model
- RTX 5060 Ti 16GB
- Card manufacturer
- ASUS
- Architecture
- Blackwell
- Manufacturing process
- 5 nm
- GPU die size
- 181 mm²
Core specifications
- Boost clock
- 2,602 MHz
Memory
- Memory size
- 16 GB
- Memory type
- GDDR7
- Memory bus width
- 128 bit
- Memory clock
- 1,750 MHz
- Memory bandwidth
- 448 GB/s
Cooling
- Fan count
- 2
Dimensions & build
- Length
- 229 mm
- Width
- 50 mm
- Height
- 120 mm
Choose your graphics card
Prices, sizes and boost clocks for graphics cards with this GPU.

No graphics cards match this selection.
Alternatives for your resolution
See how frame rate and price compare with your current choice.
RX 9070 16 GB
Change in FPS for the money: +64.2%
RX 9070 GRE 12 GB
Change in FPS for the money: +63.7%
RX 9070 XT 16 GB
Change in FPS for the money: +51%
RX 7800 XT 16 GB
Change in FPS for the money: +49.7%
RX 7900 XT 20 GB
Change in FPS for the money: +31.4%
RTX 4070 Super 12 GB
Change in FPS for the money: +25.7%
RTX 5060 Ti 8 GB
Change in FPS for the money: +59.4%
RX 9060 XT 16 GB
Change in FPS for the money: +45.4%
RX 7700 XT 12 GB
Change in FPS for the money: +47.9%
RX 9060 XT 8 GB
Change in FPS for the money: +62.5%
RX 7800 XT 16 GB
Change in FPS for the money: +49.7%
RX 9070 GRE 12 GB
Change in FPS for the money: +63.7%
RX 9070 16 GB
Change in FPS for the money: +68.8%
RX 9070 GRE 12 GB
Change in FPS for the money: +65.4%
RX 9070 XT 16 GB
Change in FPS for the money: +57.4%
RX 7800 XT 16 GB
Change in FPS for the money: +51.8%
RX 7900 XT 20 GB
Change in FPS for the money: +35.4%
RTX 4070 Super 12 GB
Change in FPS for the money: +26%
RTX 5060 Ti 8 GB
Change in FPS for the money: +57.8%
RX 7700 XT 12 GB
Change in FPS for the money: +47.9%
RX 7800 XT 16 GB
Change in FPS for the money: +51.8%
RX 9070 GRE 12 GB
Change in FPS for the money: +65.4%
RX 9060 XT 16 GB
Change in FPS for the money: +42.5%
RX 9060 XT 8 GB
Change in FPS for the money: +57.8%
RX 9070 16 GB
Change in FPS for the money: +72.8%
RX 9070 GRE 12 GB
Change in FPS for the money: +65.8%
RX 9070 XT 16 GB
Change in FPS for the money: +62.2%
RX 7800 XT 16 GB
Change in FPS for the money: +51.4%
RX 7900 XT 20 GB
Change in FPS for the money: +36.8%
RTX 5070 12 GB
Change in FPS for the money: +26.7%
RX 7800 XT 16 GB
Change in FPS for the money: +51.4%
RX 9070 GRE 12 GB
Change in FPS for the money: +65.8%
RX 7700 XT 12 GB
Change in FPS for the money: +44.1%
RX 9060 XT 16 GB
Change in FPS for the money: +39.4%
RX 9070 16 GB
Change in FPS for the money: +72.8%
RX 9060 XT 8 GB
Change in FPS for the money: +46.2%
RX 9070 16 GB
Change in FPS for the money: +61.5%
RX 9070 GRE 12 GB
Change in FPS for the money: +60.2%
RX 9070 XT 16 GB
Change in FPS for the money: +48.4%
RX 7800 XT 16 GB
Change in FPS for the money: +32%
RTX 4070 Super 12 GB
Change in FPS for the money: +30.3%
RTX 5070 12 GB
Change in FPS for the money: +22.6%
RTX 5060 Ti 8 GB
Change in FPS for the money: +54.3%
RX 7800 XT 16 GB
Change in FPS for the money: +32%
RX 9070 GRE 12 GB
Change in FPS for the money: +60.2%
RX 9060 XT 16 GB
Change in FPS for the money: +39.2%
RX 9060 XT 8 GB
Change in FPS for the money: +57.2%
RX 9070 16 GB
Change in FPS for the money: +61.5%
RX 9070 16 GB
Change in FPS for the money: +70.1%
RX 9070 GRE 12 GB
Change in FPS for the money: +69.7%
RX 9070 XT 16 GB
Change in FPS for the money: +57.8%
RX 7800 XT 16 GB
Change in FPS for the money: +39.1%
RTX 4070 Super 12 GB
Change in FPS for the money: +37.5%
RTX 5070 12 GB
Change in FPS for the money: +24.3%
RTX 5060 Ti 8 GB
Change in FPS for the money: +53.5%
RX 7800 XT 16 GB
Change in FPS for the money: +39.1%
RX 9070 GRE 12 GB
Change in FPS for the money: +69.7%
RX 9060 XT 16 GB
Change in FPS for the money: +41.5%
RX 9060 XT 8 GB
Change in FPS for the money: +55.8%
RX 9070 16 GB
Change in FPS for the money: +70.1%
RX 9070 16 GB
Change in FPS for the money: +69.1%
RX 9070 GRE 12 GB
Change in FPS for the money: +59.1%
RX 9070 XT 16 GB
Change in FPS for the money: +58.9%
RX 7800 XT 16 GB
Change in FPS for the money: +35.1%
RTX 4070 Super 12 GB
Change in FPS for the money: +32.1%
RTX 5070 12 GB
Change in FPS for the money: +26.1%
RX 7800 XT 16 GB
Change in FPS for the money: +35.1%
RX 9070 GRE 12 GB
Change in FPS for the money: +59.1%
RX 9070 16 GB
Change in FPS for the money: +69.1%
RX 9060 XT 16 GB
Change in FPS for the money: +36.3%
RX 7700 XT 12 GB
Change in FPS for the money: +27.2%
RX 9060 XT 8 GB
Change in FPS for the money: +31.6%